Solutions to 99/08/23 Problems
Use ProbSim to investigate these situations. Use the blank
screens as worksheets as you think through all the decisions and
assumptions you need to make in order to have ProbSim simulate
the situation accurately.
Problem 1.
In all poker-like card games, the "most unusual"
hand is the winner (i.e., the hand least likely to occur over
the long run).
Horace, Hillary and friends were playing cards -- "guts".
Guts is a game where people are dealt 3 cards each, and when the
dealer says "1, 2, 3, drop." People thinking their hands
aren't good enough to win drop. All the people thinking they have
a good enough hand will keep their cards.
Horace and Hillary remembered that, in 5-card poker, a flush
(all cards the same suit) beats three of a kind (three cards the
same face value). But they didn't know if that should be the case
in 3-card poker.
Use ProbSim to resolve this question.
Solution to Problem 1
The question is asking us which hand occurs less frequently
over the long run. The way to use ProbSim to resolve this question
is to set it up to deal three cards. We will have to run ProbSim
twice -- once to investigate the relative frequency of 3 of a
kind and once to investigate the relative frequency of 3 of the
same suit. I say "relative frequency" instead of just
"frequency" because we are interested in the fraction
of the time that we get each hand when 3 cards are dealt at
random from a standard deck of cards.
Assumptions:
- We are sampling from a standard card deck: 52 cards in a
deck -- 4 each of Ace, 2, 3, ..., 10, J, K, Q. Also, there are
13 cards in each of 4 suits -- Hearts, Clubs, Diamonds, and Spades.
- We are sampling one hand (a set of three cards) at random.
That is, it is impossible to predict which card will be dealt
any time a card is dealt.
- We are mixing the cards well prior to each sample. This is
to ensure that we do not bias the results of the next sample
because of the way we replace the current sample. Mixing the
cards assures us that, over the long run, we do not bias the
results.
Part a -- 3 of a kind
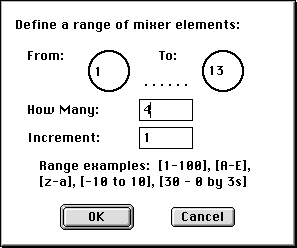 First we need to set up the mixer
so that we are sampling what we have in mind. Since we are paying attention
to the face values of cards and not their suits when we look for 3-of-a-kind,
we want to fill the mixer with "face values." We could type "A",
"2", "3", ...,"10", "J","Q","K",
but that isn't necessary. All we need are 13 different labels, and 4 of each
label. I've used the RANGE feature of ProbSim (at the right) to do this.
After setting up the mixer using the RANGE feature, ProbSim's
screen looks as below.
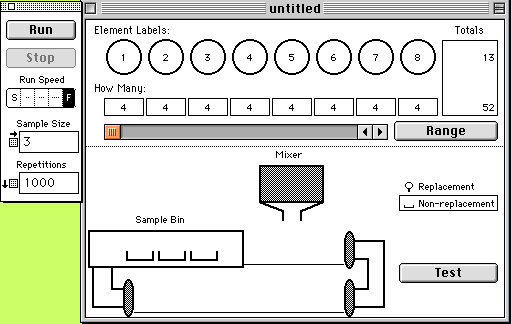
I've set up ProbSim to select 3 "cards" from the
mixer, without replacing a card once picked (but putting all the
cards back after taking one sample). It will repeat this 1000
times when I click Run. (Notice that I clicked "F"
to make ProbSim run Fast. Otherwise it would actually show
each card being selected, and that would take cause the program
to take long time to collect 1000 samples.)
Once I ran ProbSim and got some data I needed to decide how
to analyze the data.
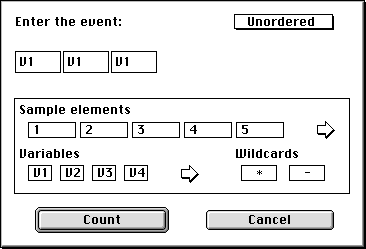 We are interested in 3
cards of the same kind. So, (1,1,1), (2,2,2), ..., and (13, 13, 13) all would
give us 3 of a kind. We could count each one separately, but that would mean
that we would have to do 13 separate analyses. We can say "three of a kind"
in general by using variables. (V1,V1,V1) means "count any instance that
has any one number appearing three times".
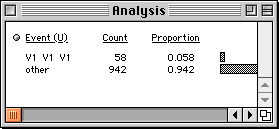
These are the results of counting the number of 3-of-a-kind
out of 1000 hands sampled from the deck (remember, we assume each
hand is placed back into the deck and the deck is well shuffled).
Results of 3-of-a-kind analysis
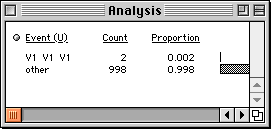
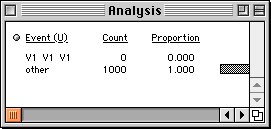
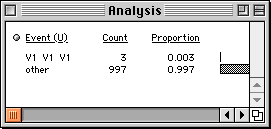
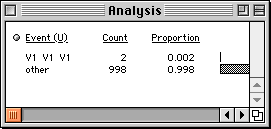
It appears that we will get 3-of-a-kind about 1/2 of 1% of
the time. That is, it seems that we will get 3-of-a-kind in less
than 5 out of every 1000 3-card hands.
Part b -- 3 of the same suit
We have the same assumptions, but a slightly different set
up for the mixer. We will have 52 cards again, but the only thing
we care about is their suit. So, it is as if we have 4 labels
(one each for Hearts, Diamonds, Clubs, and Spades) and 13 of each
label.
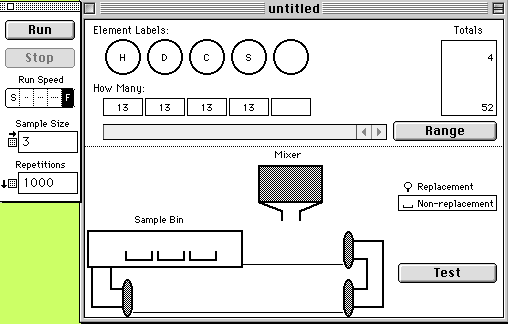
To analyze the data generated by drawing samples from this
population we need to direct the program to count those instances
where all three cards are of the same suit. To do that, we tell
ProbSim to count only those elements that have three cards of
the same label, just as before.
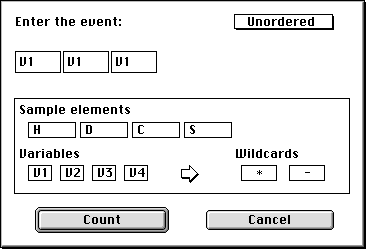
I repeated the repeat the process of gathering 1000 different
samples four times. The analyses of these four repetitions of
gathering 1000 samples are shown below.
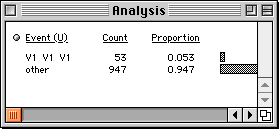
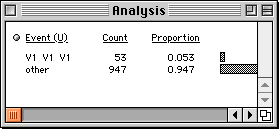
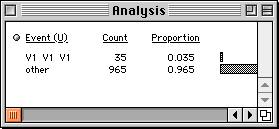
The results suggest that when we take 3 cards at random from
a standard deck a large number of times, about 5% of the time
we will get three cards of the same suit.
Conclusion
It seems that when we take 3 cards at random from a standard
deck a large number of times, it will be far more unusual to get
3 of a kind than it will be to get 3 cards of the same suit. Therefore,
a hand of 3-of-a-kind should beat a 3-card flush.
Problem 2.
The Gallup company surveyed 20 past graduates of Metro Tech,
asking them to if they were satisfied with the education that
Metro gave them. Only 61% of the graduates said they were very
satisfied. However, the administration claims that over 80% of
all past graduates are very satisfied
How unusual would a result like this be if, as MT administration
claims, 80% of all graduates are very satisfied with their Metro
education?
Solution
It is imperative the you have an appropriate image of the underlying
situation. First, there is a (presumably large) population of
Metro Tech graduates out there, and a certain percent of them
are satisfied. We don't know for sure what that percent is. The
administration claims that 80% of them are satisfied, and the
question asks us to suppose (for the time being) that the administration
is correct.
The Gallup company selected 20 people at random from the population
of MT graduates. The sample they selected had a satisfaction rate
that is very different from what the administration claims is
true for the whole population. So, we are being asked to ASSUME
that 80% of some large number of people are satisfied, and INVESTIGATE
how unusual it would be to get a sample of 20 people, selected
at random, that has around 60% of it being satisfied. That is,
we are asked to investigate what fraction of the time we get at
most 12 of 20 people being satisfied when we select the 20 at
random from a population of which 80% is satisfied.
We are not given the actual number of graduates, so we just
make up a large number, splitting them so that "Satisfied"
makes 80% of the total. This is our population from which samples
of 20 "people" (actually, labels) will be selected.

We need to set up ProbSim to take samples of size 20, without
replacement (we must not survey the same person twice).
The administration's claim is in question, so we are interested
in the fraction of samples from this population that have at
most 60% saying they are satisfied. Another way to put this
is that we can examine what fraction of the time we get at
least 8 unsatisfied graduates when we select 20 graduates
at random. This will tell us how likely it is that we get a sample
that, like ours, will throw the administration's claim into question.
The anlaysis below shows that we counted those instances where
we got at least 8 of 20 saying "unsatisfied". Repeating
this process -- taking 1500 samples and counting the number that
have at least 8 of 20 saying "unsatisfied" -- we see
that, when we assume that the population is split 80/20 as the
adminstration claims, around 3 percent of the time we would get
samples having at least 8 saying "unsatisfied".


Conclusion
It seems that when we draw many samples of size 20 at random
from a population that is actually 80% "Satisfied",
about 3% of those samples will have 60% or less saying "Satisfied".
That is, if the administration is correct, then samples like the
one Gallup took are very unusual.
So, there seems to be two possibilities. (1) Gallup did a lousy
job sampling from this population -- getting a sample that is
far from representative, or (2) the administration is inflating
its figures for political purposes and the actual percent of satisfied
graduates is much lower than 80%.
Problem 3.
The Gallup company asked 21 adults, selected at random, whether
they attended church or synagogue during the past week. Fifty
percent said they had. The Harris company performed an identical
survey. In their survey, only 33% responded "yes".
Use ProbSim to investigate whether the two polls contradict
one another.
Solution
First, "an identical survey" means that they asked
the same questions of another randomly selected group of 21 people.
Harris did not ask the same 21 people that Gallup asked.
Here's a quick analysis:
One way to approach this question would be to say, "Suppose
Gallup's poll accurately reflects the population of church goers.
How unusual , then, would be samples like Harris'?" or "Suppose
Harris's poll accurately reflects the larger population. How
unusual, then, would be samples like Gallup's?"
The only way that these two polls would not be contradictory
is if the actual population from which the samples were drawn
has some percentage between 50 and 33 that would result in samples
like Harris' and Gallup's both being more common than "unusual".

Results

The above table shows a "Count All (Unordered)" analysis
of 1500 samples (each of size 21 taken from a population that
has 42% church goers).
Samples like the Harris' (33%), which would have 7 or fewer
" Go's", happen about 28% of the time when sampling
from a population having 42% "Go's". Samples like Gallup's,
which would have 11 or more "Go's" out of 21, happen
about 23% of the time when sampling from a population having 42%
"Go's".
Conclusion
So, it seems not unusual to collect two polls by selecting
21 people at random from a population that has 42% of it attending
church in the past week and have one poll getting 33% attending
church and the other getting 50% attending church. They both could
in fact be good polls (no bias in their selection procedures).
 First we need to set up the mixer
so that we are sampling what we have in mind. Since we are paying attention
to the face values of cards and not their suits when we look for 3-of-a-kind,
we want to fill the mixer with "face values." We could type "A",
"2", "3", ...,"10", "J","Q","K",
but that isn't necessary. All we need are 13 different labels, and 4 of each
label. I've used the RANGE feature of ProbSim (at the right) to do this.
 We are interested in 3
cards of the same kind. So, (1,1,1), (2,2,2), ..., and (13, 13, 13) all would
give us 3 of a kind. We could count each one separately, but that would mean
that we would have to do 13 separate analyses. We can say "three of a kind"
in general by using variables. (V1,V1,V1) means "count any instance that
has any one number appearing three times".


