BH Stat
September 1, 1999
This assignment continues the "Favorite Musician" setting. It has a dual purpose — to get a sense for the variability among samples of various sizes and to introduce a conventional way of depicting that variability.
Your assignment is to make two histograms, by hand — one for each of the two sets of data. The first data set is of samples of size 700 taken from the Favorite Musicians data base; the second is of samples of size 2000 taken from the Favorite Musicians data base. The actual values are the percents of a sample that checked "Dave Matthews".
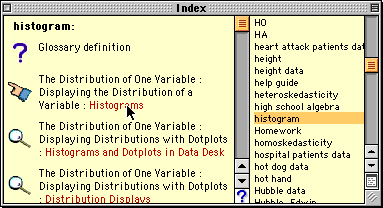
You can run the animation we viewed in class by going to your ActivStats CD, selecting Index from the Tools menu. Scroll down, click on Histogram, then click on the word "Histograms" (as shown below).
Then click on the Histogram icon (shown below).
You may also refer to your text, Section 1.1 (pp. 12-16) for reminders about making histograms.
200 Samples of size 700; Percent of each sample selecting "Dave Matthews"
| 55.14 | 58.29 | 55.86 | 55.57 | 56.71 | 58.14 | 56.29 | 55 | 54 | 55.57 |
| 53.86 | 57 | 58.29 | 55.29 | 55.14 | 56.43 | 53.71 | 53.14 | 59.29 | 59.29 |
| 50.14 | 56.86 | 52.14 | 54.43 | 52.71 | 53.86 | 57.71 | 56.57 | 57 | 56.29 |
| 52 | 57.57 | 55.43 | 55.71 | 53.14 | 53.29 | 54.71 | 58.86 | 58.86 | 58.57 |
| 55.14 | 54 | 57.14 | 53.43 | 60.86 | 59.71 | 57.86 | 54.57 | 53.57 | 54.29 |
| 58.57 | 56.57 | 57 | 54 | 57.71 | 56.71 | 52.57 | 58.43 | 57.29 | 55.29 |
| 56.71 | 55 | 55 | 55.57 | 56.43 | 53.14 | 56.71 | 59.86 | 54 | 57.43 |
| 56.71 | 55.71 | 55.29 | 55.14 | 54.71 | 54.57 | 55 | 55.29 | 59.86 | 55.57 |
| 53.86 | 56.57 | 56.71 | 52.71 | 56.86 | 52.29 | 54.29 | 60.29 | 52.71 | 54.14 |
| 54.57 | 55.71 | 57.71 | 58.43 | 56.14 | 56 | 56.43 | 57.29 | 55.71 | 54 |
| 52.86 | 55.86 | 58.43 | 56.86 | 56.29 | 59.14 | 54.43 | 56.14 | 58.29 | 53.71 |
| 57.14 | 52.29 | 59.29 | 57.29 | 56.14 | 54.71 | 54.86 | 54.29 | 55.57 | 56.29 |
| 56.86 | 53.86 | 57.71 | 54.43 | 55.29 | 55.43 | 56.43 | 55.86 | 55.14 | 53.29 |
| 56.57 | 57.14 | 55.29 | 56.57 | 54.57 | 55.43 | 53.57 | 55.57 | 53.71 | 55.29 |
| 53.43 | 54.57 | 58.43 | 54.57 | 52.57 | 54.86 | 54.71 | 56.57 | 56.14 | 53.57 |
| 57 | 56.57 | 54.57 | 56 | 52.29 | 56.86 | 55.14 | 58.71 | 58.71 | 57.71 |
| 53.43 | 53.86 | 57 | 53.29 | 54.86 | 55 | 58.71 | 52.71 | 54.14 | 54.71 |
| 60 | 57.57 | 56.86 | 55 | 55 | 54.14 | 57 | 55.14 | 53.71 | 57.14 |
| 57 | 58.71 | 58.29 | 56.71 | 52 | 57.71 | 58.57 | 58.86 | 57.14 | 56 |
| 53.43 | 55.14 | 58.29 | 58.14 | 58.71 | 58.29 | 50.71 | 57.14 | 59.43 | 54.57 |
200 Samples of size 2000; Percent of each sample selecting "Dave Matthews"
| 53.40 | 55.95 | 55.65 | 56.90 | 54.35 | 55.45 | 56.20 | 55.85 | 56.40 | 56.05 |
| 54.95 | 55.10 | 55.55 | 54.65 | 55.70 | 54.35 | 55.10 | 55.25 | 57.15 | 56.25 |
| 56.50 | 54.80 | 55.35 | 55.60 | 55.10 | 52.30 | 55.10 | 56.35 | 57.20 | 57.25 |
| 54.55 | 56.10 | 55.95 | 55.75 | 57.35 | 55.60 | 56.70 | 54.55 | 55.25 | 55 |
| 56.15 | 56.20 | 57.30 | 56.05 | 56.05 | 56.70 | 57.30 | 57.25 | 56.45 | 58 |
| 56.70 | 57.25 | 56.05 | 57.30 | 57.05 | 54.65 | 55.35 | 56.05 | 58.05 | 55.95 |
| 57.75 | 55 | 56.10 | 58.10 | 55 | 57 | 55.70 | 56.85 | 58.15 | 55.75 |
| 57.75 | 56.50 | 55.85 | 59.15 | 56.50 | 56.90 | 57.90 | 56.95 | 56.65 | 55.60 |
| 55.30 | 56.10 | 55.25 | 55.80 | 54.70 | 55.15 | 56.85 | 56 | 56.20 | 54.55 |
| 56.65 | 55.35 | 54.70 | 55.05 | 55.50 | 57.40 | 54 | 56.50 | 56.85 | 55.65 |
| 57.30 | 56.30 | 54.80 | 56.85 | 55.65 | 56.05 | 55.90 | 56.55 | 57.15 | 57.35 |
| 57.10 | 54.35 | 57.20 | 55.15 | 58.30 | 55.85 | 57.50 | 57.15 | 55.65 | 55.05 |
| 58 | 56.90 | 55.60 | 55.70 | 53.85 | 54.30 | 54.20 | 55.50 | 53.65 | 55.50 |
| 55.60 | 53.90 | 55.10 | 55 | 56.60 | 55.10 | 56 | 54.80 | 56.05 | 55.40 |
| 54.80 | 54.90 | 55.95 | 57.50 | 55.35 | 55.90 | 54.20 | 55.90 | 57.20 | 56.70 |
| 56.70 | 55.50 | 58.20 | 56.45 | 57.15 | 55.25 | 58.75 | 55.65 | 54.85 | 55.60 |
| 55.40 | 55.70 | 55.50 | 54.95 | 54.75 | 56.35 | 56.45 | 56.10 | 55.10 | 57.35 |
| 57.75 | 55.10 | 56.20 | 54.80 | 55.75 | 56.90 | 55.90 | 56.60 | 57.10 | 57.10 |
| 57.65 | 55.10 | 55.55 | 55.55 | 56.30 | 57.20 | 57.30 | 55.15 | 56.20 | 57.55 |
| 53.75 | 53.75 | 58.25 | 56.30 | 57.20 | 56.60 | 55.75 | 57.35 | 55.40 | 55.60 |