"Suppose it is assumed that about 5% of the general population uses drugs. Assume further that you employ a drug test that is 95% accurate. A person is selected at random and given the test. The test is positive. What does such a result suggest? Would you conclude that the individual is highly likely to be a drug user?"

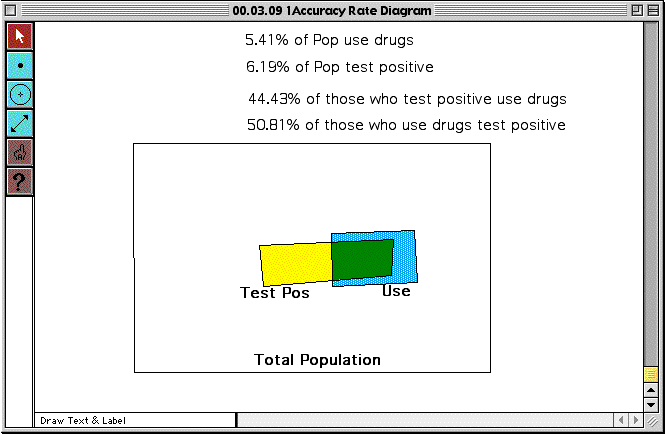
This is a screen from Geometer's Sketchpad. The various percentages update dynamically as you drag a side of either the yellow or blue rectangle (i.e., as you modify either the size of a rectangle representing the number of people who test positive, the number of people who actually use drugs, or the intersection of the two groups.
The aim of this demo is to have students represent ways that you can have an accurate test, that a relatively small portion of the population uses drugs, and yet have a high percentage of those who test positive actually not use drugs.