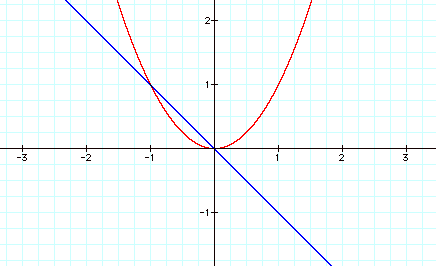
n = -1
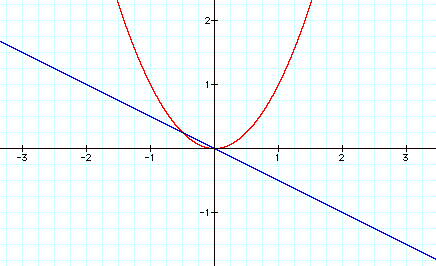
n = -0.5
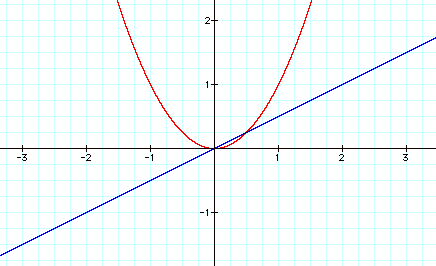
n = 0.5
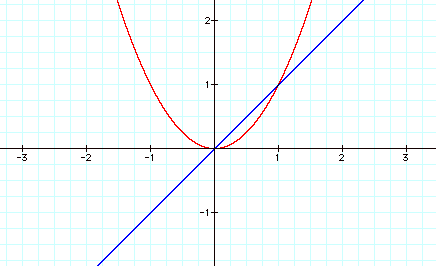
n = 1.0
Hint for Problem 1. The graphs below are of x2 and nx for n equal to –1, -0.5, 0.5, and 1. Use these graphs to plot the sum of x2 and nx. Then do the same for y = x3 + nx.
Remember! Variables vary; slow down!
(After doing this activity by hand, click here to see a live version of what you were supposed to end up envisioning. If you cannot unerstand this GC sketch by watching it, then do this hint again.)
n = -1
n = -0.5
n = 0.5
n = 1.0