Do all of these problems in polar coordinates. To graph in polar coordinates in Graphing Calculator, simply use theta as your function's argument. Type the word "theta" to get the symbol. You may define functions as normally done in Graphing Calculator. However, to make GC draw in polar coordinates, you must enter "r = (some expression)."
1. Explain how to graph the function r =
![]() in polar coordinates, where 0 ≤ theta ≤ 2pi. Then sketch the graph according to your explanation.
in polar coordinates, where 0 ≤ theta ≤ 2pi. Then sketch the graph according to your explanation.
2. Graphing Calculator continues to show the x-y coordinate plane even when you are graphing in polar coordinates. Does this matter? If so, how? If not, why? What might a "pure" polar coordinate system that parallels the conventions of a standard rectangular coordinate system look like?
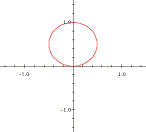
3. Enter the function r = sin(theta). The graph appears to be a circle. Is it? How can you tell for sure?
4. Make up a function r = f(theta) that has as its polar-coordiante graph:
(a) A circle of radius 2 centered at the origin of the x-y axes.
(b) A circle of radius 2 centered at (0, 1/2) in the x-y plane.
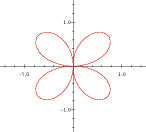
5. Graph the function y = cos(2theta), 0 ≤ theta ≤ 2pi in Graphing Calculator. Now do this: Make the graph by hand, with paper and pencil, using a ruler and a calculator.
Explain why the graph of f(theta) = cos(2theta) seems to "loop" four times. (Relate the behavior of cos(2theta) in polar coordinates to the behavior of cos(2x) in rectangular coordinates, where both theta and x vary from 0 to 2pi radians. If you really understand your explanation, then you should also be able to explain why the graph of cos(3th) appears to loop only three times, but really loops six times.)
6. Make up two neat graphs of your own . What makes each graph "neat"?
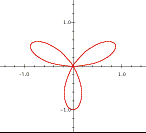
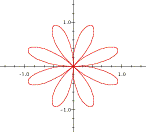
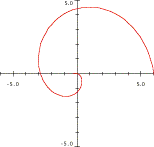
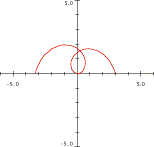
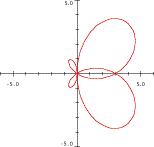
7. Devise functions whose graphs resemble these (these are all made with 0 ≤ theta ≤ 2pi). Describe the insights you developed in order to devise your functions.
The graphs below are of sin(theta), sin(2theta), etc. in the polar coordinate system. Use Graphing Calculator to investigate the general behavior of this family of graphs. Your aim should be to understand each graph deeply enough to explain how graphs within the family sin(a*theta) are related to one another. Put another way, you should be able to explain how varying the value of a affects the graph of sin(a*theta).