 .
.Here is the Cartesian graph of (x,y)=.
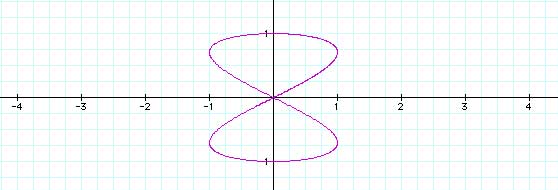
Here is another way to think of the same graph. Think of the "t" axis coming straight out at your eyes. That is, in the above graph you are looking straight down the "t" axis, with negative t being on the near side of the screen and positive t being on the far side of the screen.
Double-click on the diagram below to see how that plays out as t varies from 0 to 2 pi.