Please respond to the following in complete sentences. Construct your responses so that they communicate a clear sense of "how this works" and why it works the way it does. When asked to graph something, we expect you to use Graphing Calculator. Also, assume that all angles are measured in radians unless you are told otherwise.
1. Graph sin(x), -10 < x < 10.
a) What does x stand for? What does "-10 < x < 10" mean given what x stands for?
b) What does "sin(x)" mean for some specific value of x?
c) Click on any point on the graph. The point's coordinates are shown at the top left. What are they? What story do these coordinates tell?
d) Why does the graph of sin(x) appear as it does?
2. Examine the graphs of cos(x), cos(2x), cos(3x), cos(4x), cos(5x), etc.
Explain the relationship between the graph of cos(x) and the graph of cos(nx).
3. Examine the graphs of sin(x), sin(x/2), sin(x/3), sin(x/4), sin(x/5), etc.
Explain the relationship between the graph of sin(x) and the graph of sin(x/n). Is this relationship different from the one you came up with in Problem 2?
4. Juan said, "The function sin( ) has a period of 2π, which means that it goes through a full cycle whenever whatever is in the parentheses varies by 2?. So, sin(5+3x) goes through a full cycle whenever 5+3x varies by 2π."
a) What does Juan mean? Say this in your own words?
b) How does his insight explain the behaviors of sin( ) and cos( ) in numbers 2 and 3?
c) How
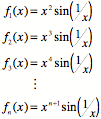
does Juan?s insight explain the behavior of sin(x2)? sin(1/x)?
5. Explain the "microscopic" behavior of ![]() .[1], [2]
.[1], [2]
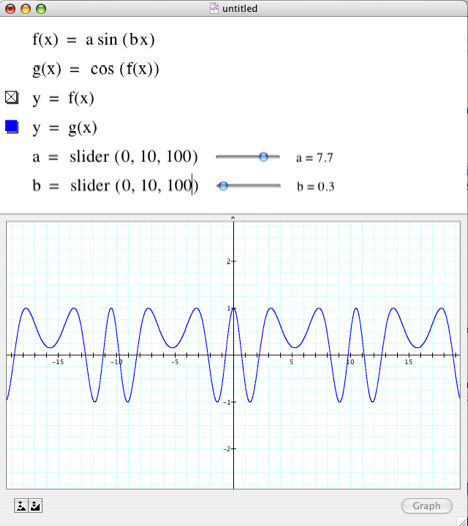
6. Use a slider[3] to explore the effect that a and b have on the behavior of these functions (0<a<10, 0<b<10). Explain both the parameter's effect and your reasoning while exploring it.
a) g(x) = a sin(bx) See footnote [4]
b) h(x) = cos(g(x)) [g(x) defined as above; see footnote 4]
7. Attend to these function's behavior both as |x| becomes very small and as |x| becomes very large.
a) Describe what, in general, is happening as |x| gets very small.Why does this happen?
b) Describe what, in general, is happening as |x| gets very large. Why does this happen?
c) What does this pattern suggest about the value of xsin(1/x) as |x| gets large? What does this suggest about the value of sin(x)/x as x gets very small?