is taught as if it is about values on the x axis that make this statement true. While this is correct, it is not the only way to think of inequalities in one variable.
We could also embed the idea of inequalities into our work with functions of one variable.
If we graph y = x4 + x3 - 3x2 - x, y = 1, and y = -1 we get a visual display of values of x that produce values of y that are
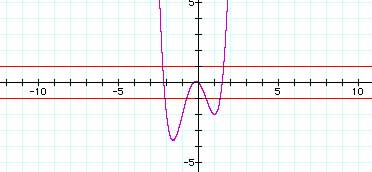 greater than 1,
- less than -1,
- between 1 and -1.
All those values of x that produce values of y between -1 and 1 will make "|x4 + x3 - 3x2 - x| < 1" a true statement. From the graph, we see that the values of x that make this statement true are, approximately, (-2.25,-2.0), (-1.8,0.5), (1.25,1.5).
After visualizing the solution set to this inequality, the task then becomes to identify the boundaries of those intervals precisely. We see that we need to determine those values of x for which x4 + x3 - 3x2 - x is 1 (2 places), and for which x4 + x3 - 3x2 - x is -1 (4 places). While this is not a small task, it is conceptually clear what we are trying to find and it is intuitively clear where we need to look for those boundaries.
Inequalities in 2 variables
In the same way that we can embed inequalities in one variable into all that we know about functions of one variable, we can embed inequalities in two variables into all that we know about functions of two variables.
The movie below builds from an earlier activity, in which we first evaluated an expression in two variables by substituting points' coordinates into them systematically, and then we enacted a "search" for points in the plane whose coordinates satisfied an inequality involving that expression. In this movie, we go from conducting a "search" in the x-y plane for points whose coordinates satisfy the inequality |xy + y2| < 2 to thinking of the solution set in the x-y plane in relation to the graphs of z = xy + y2 and z = 2.